ontario spring bear hunt
Bear Wise

You may not even know you're doing it.

Simply by leaving pet food out at night, leaving food residue on your barbeque grill, or especially if your household garbage is stored in easy to open bags or in poorly sealed containers, you could be inviting bears to forage for leftovers.

Ontario is Bear Country

By following a few Bear Wise habits, people can discourage bears from visiting their homes, farms, businesses, cottages and property. However, it takes everybody working together to keep bears away from communities and neighbourhoods.

Ontario is bear country. Chances are you live near bears.

If you are not convinced that people can eliminate bear activity, think about this. In 2010 the leading causes of bear problems were the result of:

  • Residential garbage
  • Food smells (including dirty barbecues)
  • Fruit trees

Help keep people safe and bears wild. Here's how you can get involved:

  • Learn about bears and what can attract them to your property.
  • Know what you should do if you see or encounter a bear on your property.
  • Take steps to remove or control items known to attract bears.
  • Encourage your neighbours and your community to practice Bear Wise habits.
click for full article

Black bears rarely attack people

While they can be dangerous, they are actually very timid animals. Since the early 1900s there have been fewer than 70 deaths in North American as a result of black bears.

While injuries and attacks are rare, we need to remember that bears are easily attracted to places where people live. Bears are attracted to communities by things like garbage, bird and pet food, and smells like grease and food residue on barbecues. They will investigate these non-natural food sources. If bears are successful at getting food they will return again and again. They will also lose their natural fear of humans if they are successful at finding food where humans live, camp, work or recreate.

Here are some precautions you can take:

At your home, camp or cottage:

  • Feed birds only during the winter
  • Keep your garbage away from bears

Outdoors:

  • Learn about black bears, signs of bear activity and how to prevent and handle encounters with bears.
  • Be alert. Keep your eyes and ears open. Frequently scan your surroundings to check for bears.
  • Take extra precautions with your food and garbage.

At work:

  • Have a plan for garbage. Use bear-resistant containers wherever possible and secure the lids at all times.
  • If you are in “back country” learn how to carry and use bear pepper spray. Know its limitations.
  • Learn bear safety basics. Know how to prevent and handle encounters with bears.
click for full article

Bear Wise Provincial Statistics

  2004/05 2005/06 2006/07 2007/08 2008/09 2009/10 2010/11
Total Funding 5,025,000 4,525,000 4,073,000 4,100,600 4.500,600 4,500,600 3,600,600
(LESS 9M COMMUNITY FUNDING)
Community funding Program 194 projects from 96 communities 137 projects from 91 communities 117 projects from 77
communities
60 projects from 50 communities 83 projects from 70
communities
79 projects from 70 communities 0
Community Funding $900,000 $900,000 $735,000 $700,000 900,000 1,000,000 0
*Number of Communities Participating in Bear Wise 138 120 177 230 275 TBD one district still to report TBD
**Number of Occurrences 8547 10,500 7016 12,645 9745 13,020 9874

*Includes MOU’s Response agreements and/or received Community Funding
**Resulted in action from a district – may vary from phone to on site response
Note: In 2007/2008 the criteria for community funding was modified to reflect a maturing of the program and supports large infrastructure type projects as opposed to the softer education and awareness projects. Less projects with higher $ values.

Number of Communities Participating in BW

Fiscal Year Target** Actual Achieved
2004/05*   12%
2005/06*   25%
2006/07 40% 31%
2007/08 60% 40%
2008/09 65% TBD
2009/10 70%  
2010/11 75%  
2011/12 75%  

* Based on 463 communities
2006/07 & beyond based on 577 communities
** forecasted based on optimism - no science to support that these numbers are achievable.

2006/2007 was the first year program targets were formally set based on estimated levels of participation. Out year targets may need to be assessed on further analysis from other jurisdictions and societal norms. This assessment could be included in the program evaluation.
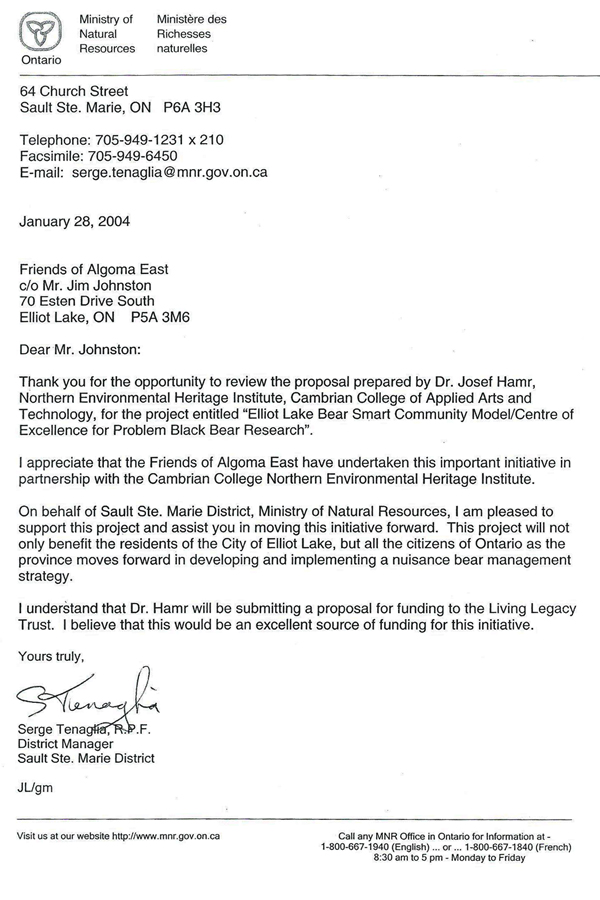

Bear Wise Dist Mgr Letter

Bear Wise Gail Begg Dep Minister

OMNR 9YR Summary Occurrencesand response details to end 2012

  2004         2005         2006         2007         2008         2009         2010         2011         2012 No Trap Directive       Occurrences 7 year AVERAGE 2004/2011   7yr 7yr   9 year AVERAGE 2004/2011   7yr 7yr
 
NER Occurrences # Trap set # Chem. Imm #Killed   Occurrences # Trap set # Chem. Imm #Killed   Occurrences # Trap set # Chem. Imm #Killed   Occurrences # Trap set # Chem. Imm #Killed   Occurrences # Trap set # Chem. Imm #Killed   Occurrences # Trap set # Chem. Imm #Killed   Occurrences # Trap set #Chem imm #Killed   Occurrences # Trap set #Chem imm #Killed   Occurrences # Trap set # Chem Imm #Killed       high low       high low
Chapleau 137 18 3 0   97 12 0 1   29 7 0 1   110 18 7 10   71 4 1 6   98 37 0 4   50 21 0 8   15 2 0 2   36 0 1 4   76   137 29   76   110 15
Cochrane 94 7 0 1   183 15 6 31   53 2 2 8   241 14 11 28   55 4 3 4   121 43 10 6   289 83 6 12   27 3 0 3   18 0 0 1   133   289 53   133   289 27
Hearst 101 18 8 4   200 42 14 27   36 8 0 4   255 33 1 31   33 3 0 2   69 43 0 3   187 61 0 17   48 16 0 1   22 1 0 4   116   255 33   116   255 33
Kirkland Lake 153 12 0 6   129 12 0 13   76 5 0 6   624 59 2 32   105 6 3 8   117 30 0 6   89 23 0 4   85 13 8 9   74 2 2 2   172   624 76   172   624 76
North Bay 295 25 2 2   519 69 5 4   247 15 0 2   752 30 19 41   244 7 10 10   471 26 4 22   424 27 5 15   247 10 1 20   124 0 0 8   400   752 244   400   752 244
Sault Ste. Marie 1043 12 8 0   976 47 27 10   977 27 11 2   818 26 27 21   1452 35 19 21   2089 108 6 35   805 30 15 17   612 8 9 16   660 0 4 15   1097   2089 805   1097   2089 612
Sudbury 1342 22 3 6   1448 79 48 9   1794 67 35 15   2684 112 55 13   3570 117 44 23   3295 212 32 30   1555 146 22 38   1296 73 11 33   1022 6 4 29   2123   3570 1342   2123   3570 1296
Timmins 202 2 4 0   995 52 32 28   164 1 2 0   1447 51 47 22   317 9 13 2   388 32 16 6   799 57 39 10   232 4 2 5   779 3 18 21   568   1447 164   568   1447 164
Wawa 138 12 6 5   269 43 0 11   242 20 1 14   459 51 1 44   175 22 0 14   245 50 1 22   414 94 0 20   46 7 0 4   97 0 1 4   249   459 138   249   459 46
 
NER Total 3505 128 34 24   4816 371 132 134   3618 152 51 52   7390 394 170 242   6022 207 93 90   6893 581 69 134   4612 542 87 141   2608 136 31 93   2832 12 30 88             4933      
 
NWR                                                                                                            
Dryden 253 11 0 3   253 25 0 10   125 14 0 8   71 11 0 7   126 26 0 7   162 66 4 4   96 39 0 4   215 46 0 13   37 0 0 7   155   253 71   163   253 71
Fort Frances 136 2 1 1   185 17 14 5   165 6 7 3   87 6 3 4   107 13 7 8   144 57 3 3   97 35 5 7   132 15 10 8   55 1 1 9   132   185 87   132   185 87
Kenora 63 2 2 0   434 108 41 22   327 45 19 10   212 29 33 7   170 53 3 9   207 49 5 5   316 61 10 14   549 43 34 31   115 0 0 1   247   434 63   285   549 170
Nipigon 458 60 10 4   608 60 12 40   415 72 12 23   692 85 15 12   491 27 2 21   480 117 22 22   584 166 30 21   189 60 15 6   326 3 2 19   533   692 415   490   692 189
Red Lake 160 29 10 22   273 40 7 46   108 18 3 15   51 5 0 10   45 10 4 1   66 27 5 5   115 33 3 2   90 8 1 13   44 0 0 6   117   273 45   114   273 45
Sioux Lookout 129 16 1 0   142 32 3 15   44 2 0 0   50 6 0 1   37 6 0 2   74 9 4 4   98 11 0 0   83 2 0 2   83 0 0 10   82   142 37   82   142 37
Thunder Bay 638 43 11 0   520 42 13 3   484 25 6 19   599 29 33 22   389 35 5 11   775 72 10 10   816 44 14 10   255 16 9 11   416 1 15 8   603   816 389   560   816 255
 
NWR Total 1837 163 35 30   2415 324 90 141   1668 182 47 78   1762 171 84 63   1365 170 21 59   1908 397 53 53   2122 389 62 58   1513 190 69 84   1076 5 18 60             1824      
 
SR                                                                                                            
Aurora 165 1 0 1   101 0 2 0   62 0 0 0   63 0 0 0   67 0 1 0   93 0 1 0   117 1 0 0   115 0 0 2   75 0 0 2   95   165 62   98   117 62
Alymer                                         22 0 0 0   7 0 0 0   15 0 0 1   7 0 0 0   1         15   22 7   6   22 7
Bancroft 852 18 5 4   657 19 7 8   276 9 5 4   530 9 5 6   366 9 3 19   672 32 3 15   409 16 2 8   484 13 4 9   294 0 0 6   537   852 276   531   672 276
Guelph                               2 0 0 0   14 0 0 1   60 0 0 0   38 0 0 0   10 0 0 0   12         29   60 2   16   60 2
Kemptville 242 0 1 3   371 2 4 4   266 0 0 5   172 0 0 9   320 4 3 6   241 5 0 8   298 1 2 3   193 0 1 0   155 0 0 2   273   371 172   263   371 172
Midhurst 432 2 3 1   414 5 3 1   271 1 2 3   606 12 6 13   467 7 0 7   653 12 5 9   640 14 2 9   462 4 1 10   261 1 0 8   498   653 271   493   653 271
Parry Sound 969 21 1 5   1119 53 33 18   429 9 9 4   1568 42 24 32   770 33 23 24   1522 85 31 20   1218 61 12 18   962 23 12 26   636 0 0 28   1085   1568 429   1070   1568 429
Pembroke 105 1 1 1   263 23 5 1   57 0 0 2   189 8 0 1   96 2 1 4   471 17 17 10   176 5 2 2   117 0 0 7   102 0 0 0   194   471 57   184   471 57
Peterborough 445 3 2 3   353 6 3 13   388 0 0 0   421 1 0 5   245 0 0 6   504 5 5 8   235 6 1 7   203 1 1 3   350 1 0 9   370   504 235   349   504 203
 
SR Total 3210 46 13 18   3278 108 57 45   1749 19 16 18   3551 72 35 66   2367 55 31 67   4223 156 62 70   3146 104 21 48   2553 41 19 57   1886 2 0 55             3010